A cosmic musical box
How a star map can be used as a “musical box”? First of all, let’s start by defining what a star map is. Well, as the name suggests, a star map is a map that shows the stars, planets, and other celestial objects at a specific time. Unlike a regular cartographic map, star maps vary depending on the date and coordinates, due to the geometry and various movements that the Earth undergoes throughout the year. A star map calculated in February is not the same as one in August.
There are many websites where you can create star maps for free. I used YourSky. This website allows you to obtain a star map by simply entering the coordinates and the desired date and time. It also allows you to filter stars by their magnitude, locate planets, add constellations along with their names, and view both past and future dates.
I decided to use a star map as the source for a musical box to commemorate a special date. It’s a fun way to give a gift for an anniversary or special occasion. Additionally, due to the nature of the celestial vault, no two dates will be the same, resulting in a virtually infinite algorithm for musical generation.
Let’s start by obtaining the star map. To do this, we access the mentioned website and enter the desired data. In my case, I want to use a special date, which is February 27, 2020. Once the map is generated, we save it; it will be saved in .gif format. We can convert it to .png using any photo editing program or a Python script. Once we have the star map created and saved, we move on to the musical box concept.
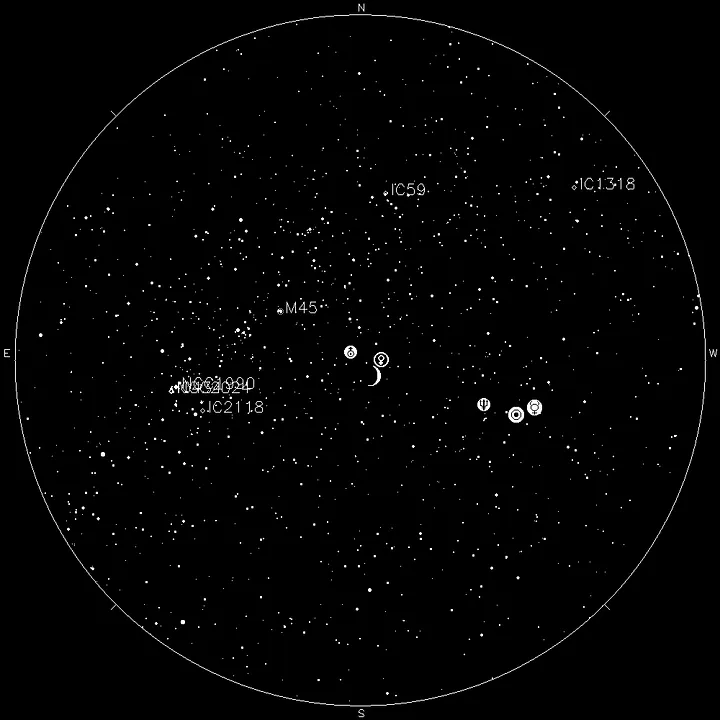
To do this, let’s think about how music is represented on a staff. There are 5 lines with musical notes on them. With this in mind, we can see a similarity with the star map, as it is a grid with points representing stars. The main difference between the staff and the star map is that one is in a “square” representation, and the other is in a polar representation.
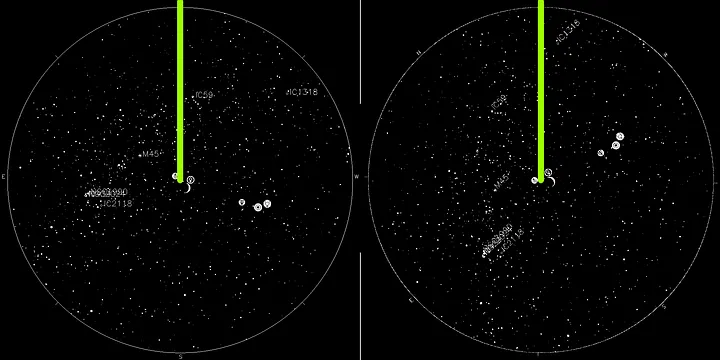
We can convert one into the other. For the sake of simplicity, it’s most practical to convert the star map into a square representation. For this part, we need to get our hands on some programming language. As usual, I chose Python for its simplicity. Since the image is loaded as a matrix of pixels, we can choose the central column and cover from the center of the image to the upper edge. We save these pixels in an array and proceed to rotate the image a certain number of degrees. The degree of rotation is up to you, but keep in mind the following: as it’s a transformation from polar to rectangular coordinates, there will be some distortion in the resulting image. This distortion will be similar to what you find in the Mercator projection of current world maps.
We repeat the process of rotating the image and storing the pixels in the array. At the end of this process, we obtain an image that is the rectangular representation of the star map. It’s an image with a dark background and white points on it. Now, when we look at this image, we can notice a greater resemblance to a musical staff. The points on the bottom will be the low notes, and the ones on top will be the high notes. We can traverse the image from left to right, and we already have a score made with the star map of our special date.
To continue, we can take two paths:
-
The discrete path: This uses the resulting image to create a MIDI file, which we can use to feed a virtual instrument in our DAW (Digital Audio Workstation). For this, we need to select additional parameters that determine the volume and duration of each note. This can be represented using the magnitude of the stars (their brightness) and the size with which they are represented. Another option for this is to leave the notes with fixed duration and volume.
-
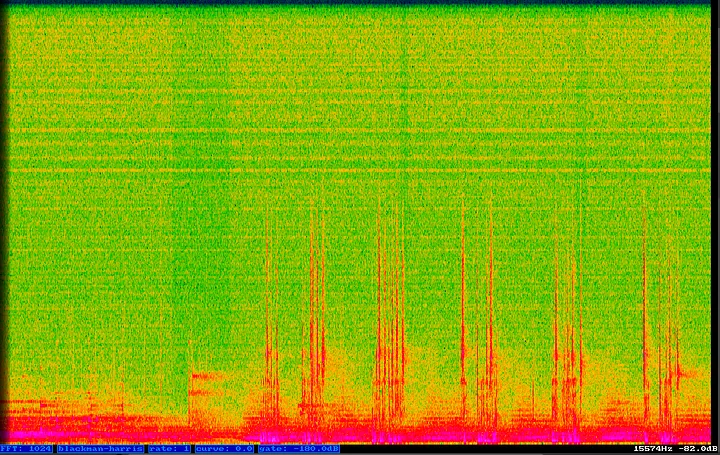
The continuous path: This uses the image to generate a spectrogram. A spectrogram is a visual representation of sound, plotted using the lower part of the image as low frequencies (from 20 Hz) and the upper part as high frequencies (up to 20,000 Hz). The mapping of frequencies is continuous, so values will be assigned to frequencies that do not belong to any musical note. Additionally, the intensity of the sound and its duration are automatically assigned based on the color and the time it takes in the image. This path can lead to interesting results by playing with microtonalities and less common frequencies in contemporary music. To convert the spectrogram image into sound, a mathematical tool called the Fourier transform is used. Don’t worry, you don’t need to know how to do this; there is software and libraries that make it easy to accomplish.
I chose the first path to make it sound more like a musical box. What I did was discretize the image and divide it into two octaves. Where there is a star within a certain range, there will be a musical note. Since musical boxes use notes with the same duration and volume, I did the same to make it resemble one. Now we have the MIDI file, and it’s time to move to the DAW to compose the music that will accompany this musical box.
This is where it becomes purely artistic, with no limitations. We can add as many effects as we want, modify the MIDI file by cutting, extending, or shortening it.
I created an ambient piece to commemorate the peace of a special date. The work can be found at the following link:
it´s a cold day, and i just made a cup of coffee to sit and watch the rain fall
So, this is where today’s adventure under the stars ends, creating a melody from the stars!